Managing Alerts
Cloudpie enables users to view, configure, and resolve alerts for cloud accounts. Alerts can be auto-resolved when the cloud platform reports them as no longer an issue or manually resolved with a resolution note. This document explains how to navigate the alerts page, configure alerts for different cloud platforms, view alert details, and resolve alerts.
Viewing Alerts
- Navigate to the Dashboard and select the project.
- Select the Cloud Account for which you want to view alerts.
- Click on the "Alerts" menu in the sidebar.
-
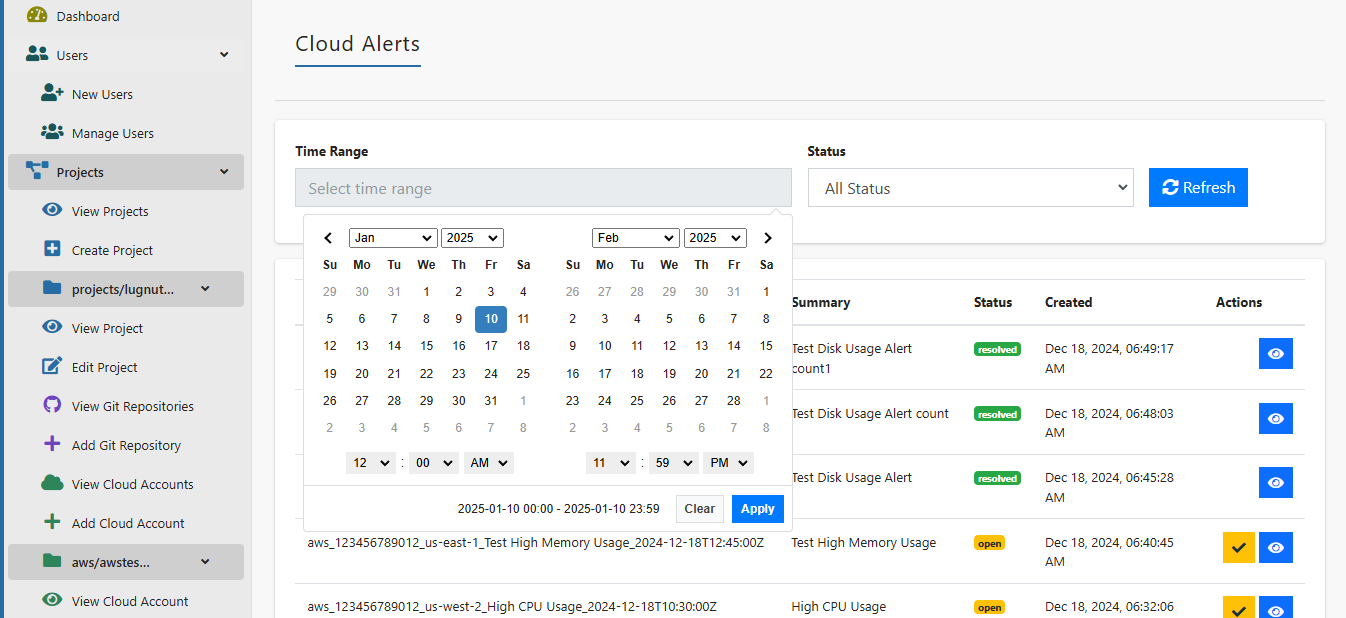
Use the following filters to refine the alerts list:
- Time Range: Specify a date range to view alerts created within that period.
- Status: Filter alerts by status (e.g., Open, Resolved).
-
Click the Refresh button to load the latest alerts.
Example Screenshot: Alerts Page
Configuring Alerts in Cloud Platforms
To configure alerts, use Cloudpie’s API endpoints. Below are the configurations for AWS, GCP, and Azure:
AWS Alert Configuration
- Use the AWS Management Console, CLI, or SDK to create a CloudWatch alarm.
-
Set the alarm action to trigger an HTTP POST request to Cloudpie's alerts endpoint:
Example Payload:
{
  "AlarmName": "High CPU Usage",
  "AWSAccountId": "123456789012",
  "Region": "us-west-2",
  "StateChangeTime": "2025-01-10T10:30:00Z",
  "NewStateValue": "ALARM",
  "NewStateReason": "CPU utilization exceeded 80% threshold",
  "Trigger": {
    "MetricName": "CPUUtilization",
    "Namespace": "AWS/EC2",
    "StatisticType": "Statistic",
    "Statistic": "AVERAGE",
    "Unit": "Percent"
  }
}
GCP Alert Configuration
- Create an alerting policy using the Google Cloud Console or Monitoring API.
-
Configure a webhook notification channel pointing to Cloudpie’s endpoint:
Example Payload:
{
  "incident_id": "12345-67890",
  "state": "open",
  "resource_name": "projects/my-project-id",
  "policy_name": "High CPU Usage",
  "condition_name": "CPU Utilization Exceeds 80%",
  "condition_threshold_value": 80,
  "condition_threshold_unit": "percent",
  "start_time": "2025-01-10T10:30:00Z"
}
Azure Alert Configuration
- Use the Azure Portal or CLI to create an alert rule.
-
Add an action group configured with a webhook pointing to Cloudpie’s endpoint:
Example Payload:
{
  "data": {
    "essentials": {
      "alertId": "abc123",
      "severity": "Sev3",
      "signalType": "Metric",
      "monitorCondition": "Fired",
      "alertRule": "High Disk Usage"
    },
    "alertContext": {
      "condition": {
        "metricValue": 85,
        "threshold": 80
      }
    }
  }
}
Viewing Alert Details
- From the alerts list, click the View Alert icon next to the alert you want to view.
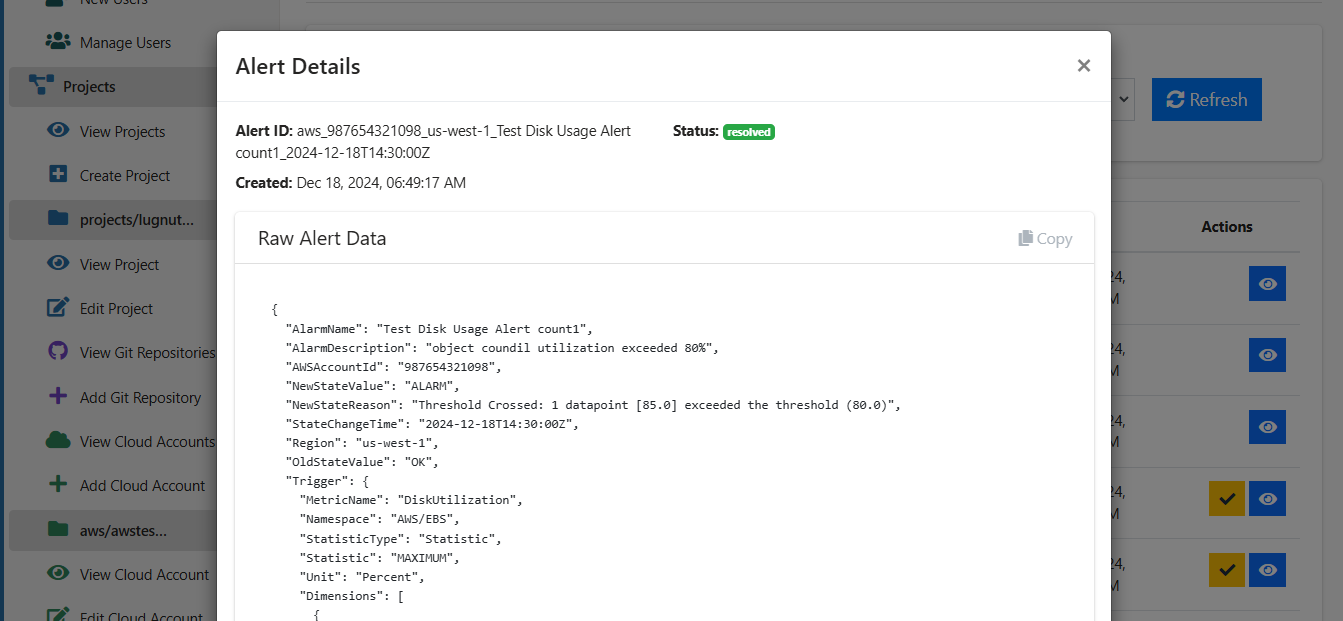
- The alert details page provides:
- Metadata: Includes ID, creation time, and status.
- Raw Alert Payload: Displays the original alert data received from the cloud platform.
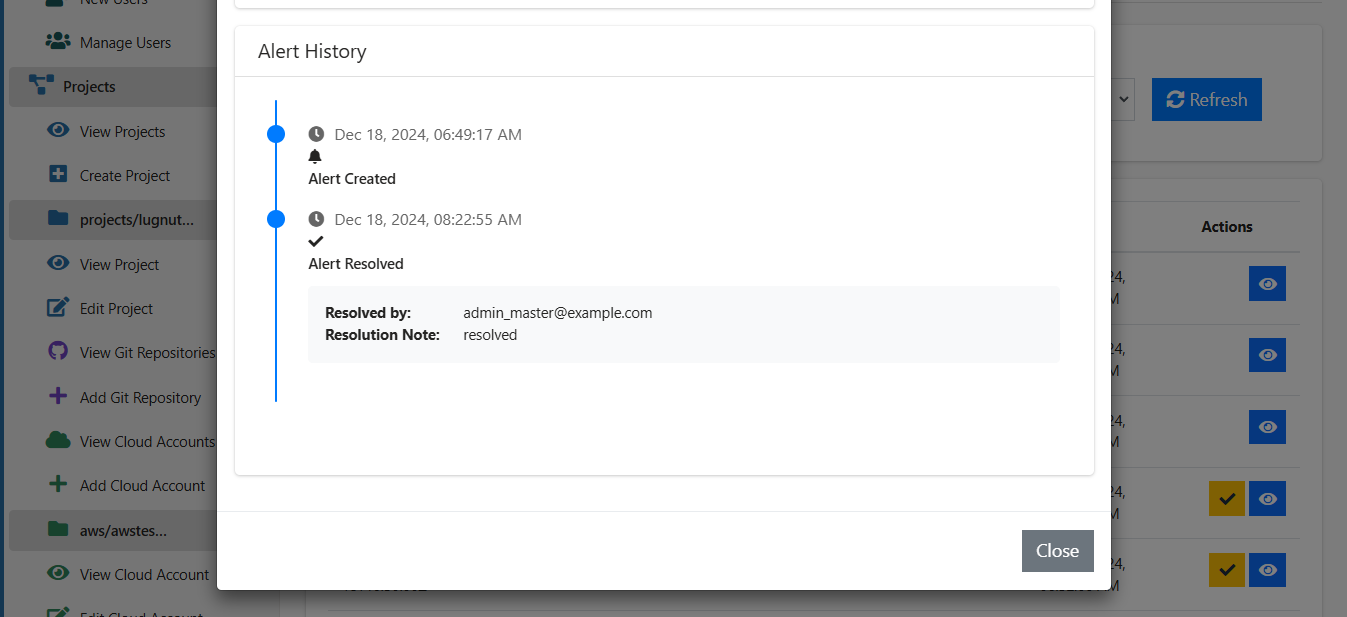
- Alert History: Shows a timeline of changes to the alert’s state.
Example Screenshot 1: View Alert Details
Example Screenshot 2: View Alert Details
Resolving Alerts
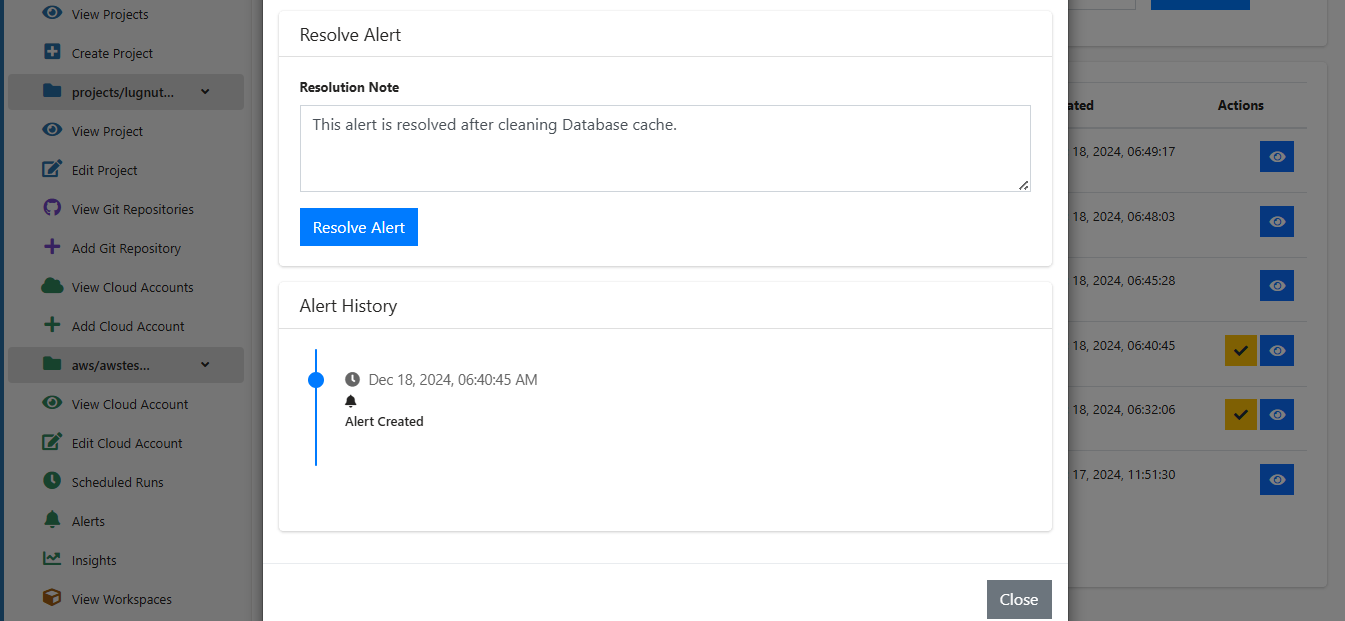
- From the alerts list, click the Resolve Alert button next to an open alert.
- Enter a Resolution Note describing the resolution action.
- Click Resolve Alert to mark the alert as resolved.
- The alert’s status is updated, and the resolution note is logged in the alert history.
Example Screenshot: Resolving an Alert
Notes
- Alerts can be auto-resolved when the cloud platform reports that the condition causing the alert is no longer active.
- Use the refresh button on the alerts page to fetch the latest data.